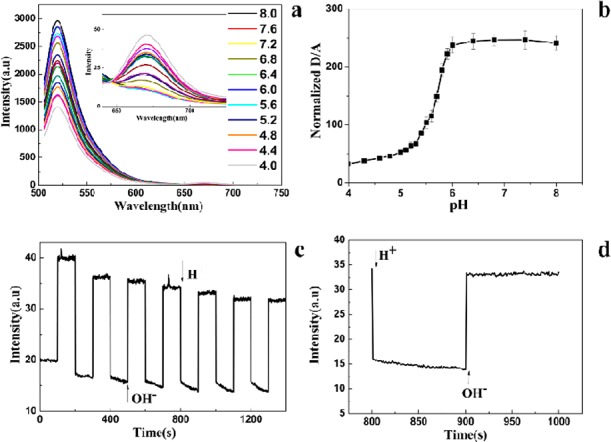
Figure 1.

In vitro characterization of the t-switch. (a) Emission responses of the t-switch (80 nM) toward the pH change in PBS (20 mM). Inset: pH-dependent responses of emission between 640 and 750 nm. (b) Calibration curve of the t-switch showing normalized donor/acceptor (D/A) intensity (Alexa-488/Alexa-647) ratios. (c) Working cycling of the t-switch. Fluorescence intensity was monitored at 520 nm and excited at 488 nm while the solution pH value oscillated between 5.0 and 8.0. (d) Response time for the transition between the open and closed states. Addition of base and acid was shown by arrows.
