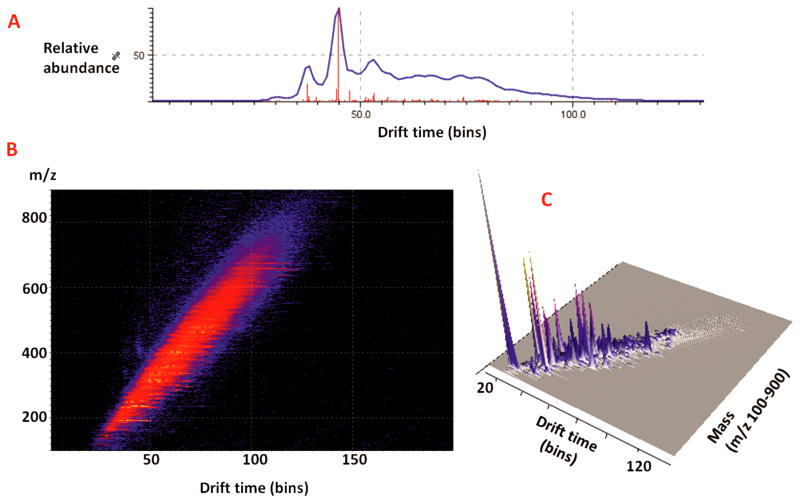
Figure 3. Ion mobility separation of MD-CE fractions.
(A) Total ion chromatogram of MD-CE fraction with migration time at 11 min which is further separated by ion mobility mass spectrometry. (B) Image from driftscope showed drift times of small molecules from m/z 100 to 900. (C) As shown in 3D driftscope image, isobaric molecules in one MD-CE fraction were successfully separated by their drift times.

