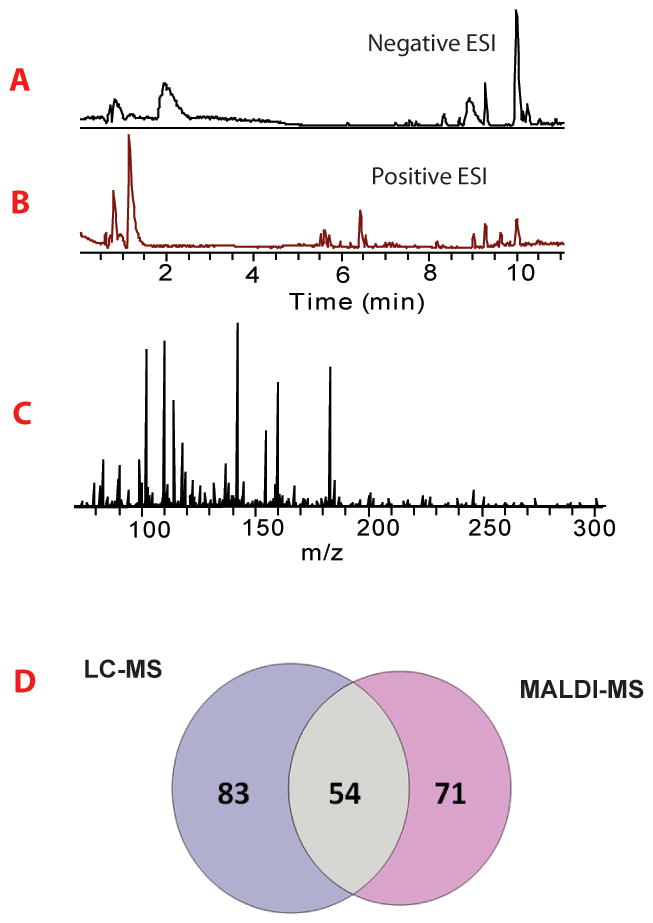
Figure 5. Untargeted LC-MS analysis of hemolymph metabolites.

(A) Base peak ion chromatogram acquired in negative ion mode. (B) Base peak chromatogram acquired in positive ion mode. (C) Averaged mass spectrum of detected mass features. (D) Venn diagram showed comparison of metabolomics identification of MALDI-MSI and LC-MS platform. 83 metabolites were uniquely identified by LC-MS, while 71 metabolites were exclusively found by the MALDI-MSI platform.
