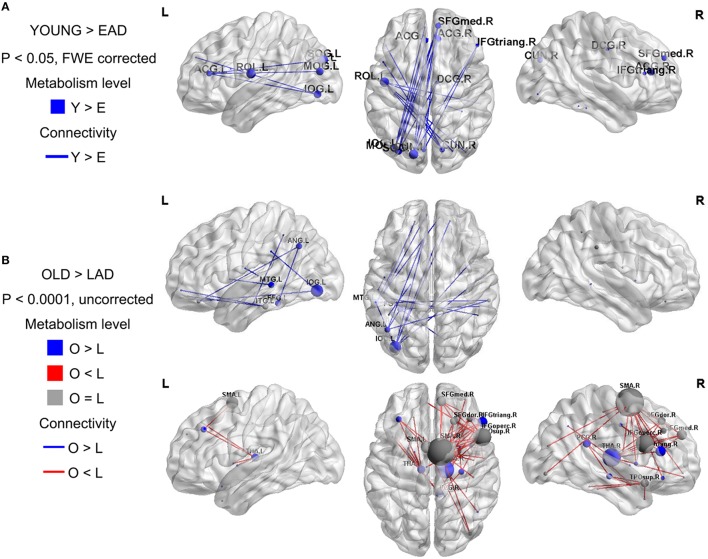
Figure 2.
Metabolic connectivity differences between the Alzheimer's disease (AD) and control groups. The node color indicates differences in the metabolic levels while its size indicates the differences in metabolic connectivity. The line color indicates differences in metabolic connectivity. Nodes larger than three are presented in the figure as an acronym. The early-onset Alzheimer's disease (EAD) group has decreased metabolic connectivity compared to young control (YOUNG) group (p < 0.05, FWE corrected) (A). The late-onset Alzheimer's disease (LAD) group has no differences in metabolic connectivity compared to the old control (OLD) group (p < 0.05, FWE corrected). However, LAD has both decreased and increased metabolic connectivity at a lower threshold (p < 0.0001, uncorrected) (B).

