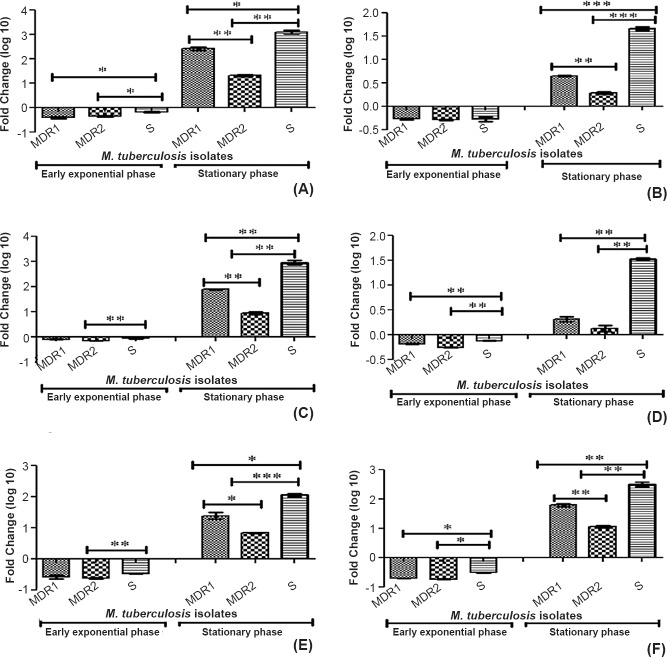
Fig. 2.
Relative expression (fold change in logarithmic graphics) analysis of mce1A gene (A), mce1D gene (B), mce2A gene (C), mce2D gene (D), mce3A gene (E), mce3C gene (F) of M. tuberculosis isolates (multi-drug resistant and sensitive) during two different growth stages (early-exponential and stationary phases) using gene specific primers by real time PCR. MDR1-Multi-drug resistant isolate (resistant to rifampicin, isoniazid, ethambutol), streptomycin, MDR 2- multi-drug resistant isolate (resistant to both isoniazid and rifampicin), S, sensitive isolate. P*<0.05, **<0.01, ***<0.001.

