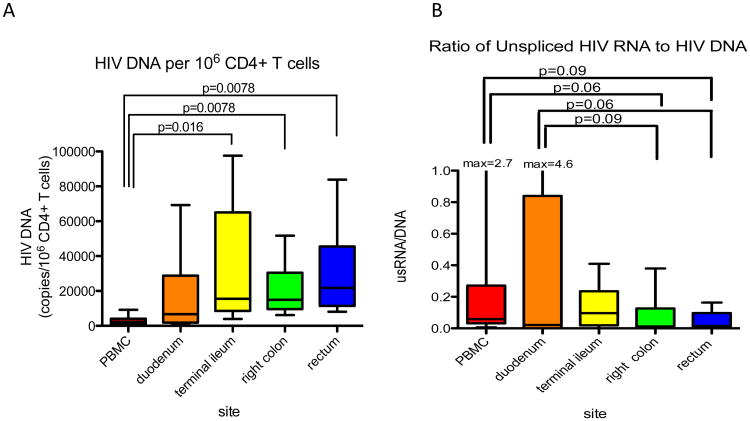
Figure 1.
A) HIV DNA copies per million CD4 cells present in blood or different gut sites from 8 patients on ART with undetectable plasma virus. B) Ratio of HIV RNA (unspliced, genomic) to HIV DNA providing measures of HIV expression per average infected cell. Horizontal bars = medians; whiskers show standard deviations. Adapted from Yukl et al JID 2010[61]

