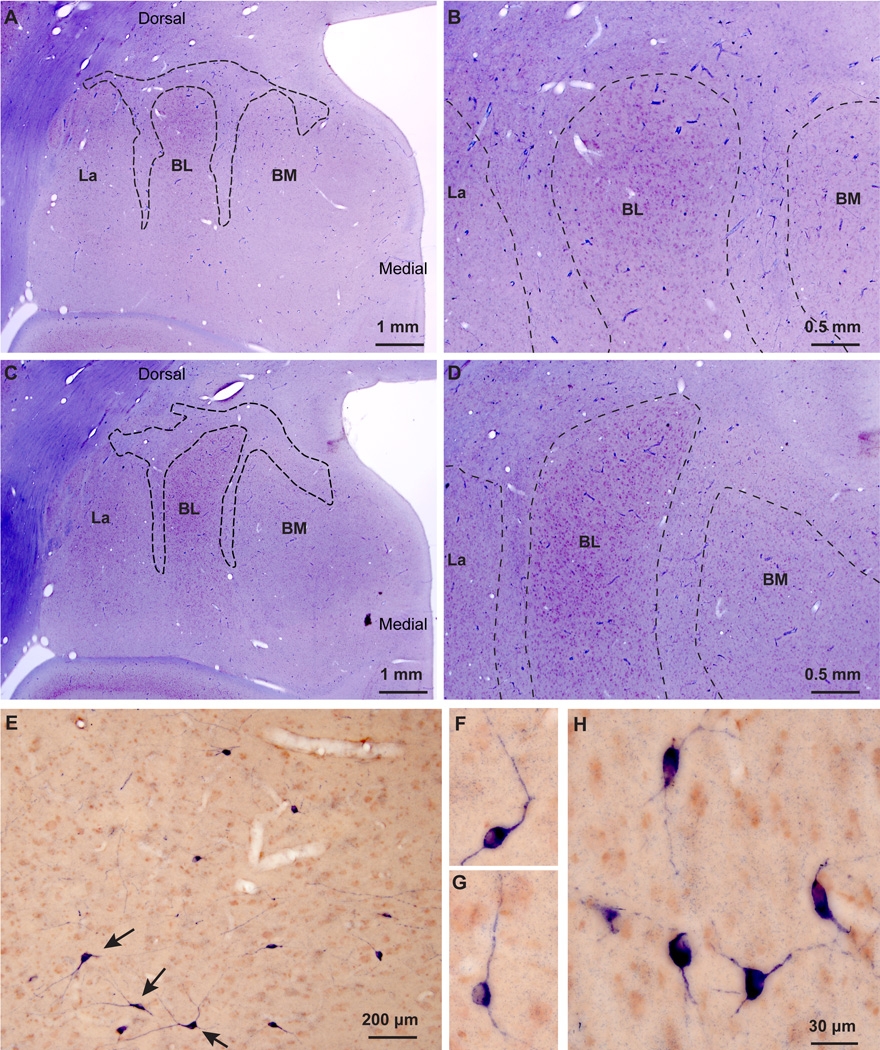
Figure 7.
NADPHd in the IM of the rhesus monkey amygdala. A–D, Low (A, C) and matching higher (B, D) magnification of the amygdala in serial coronal brain sections show cytoarchitectonic features and NADPHd label. Dotted outlines (A, C) indicate approximate borders of IM neuropil. This histochemical reaction labels neuronal processes in a Golgi-like manner, highlighting the increased density of NADPHd+ neurons and the continuity of labeled neurons and their processes in the IM neuropil. Counterstaining with neutral red contrasts the blue IM neuropil region between the main amygdalar nuclei, which is rich in glia, myelinated fiber tracts, and has a high density of NADPHd+ neurons and processes, against a darker, mostly purple/red region occupied by larger neurons in other nuclei. E–H, High magnification shows small/medium (E–G) and large (E: black arrows, H) NADPHd+ neurons and their processes in IM. Scale bar in H applies to F–H.

