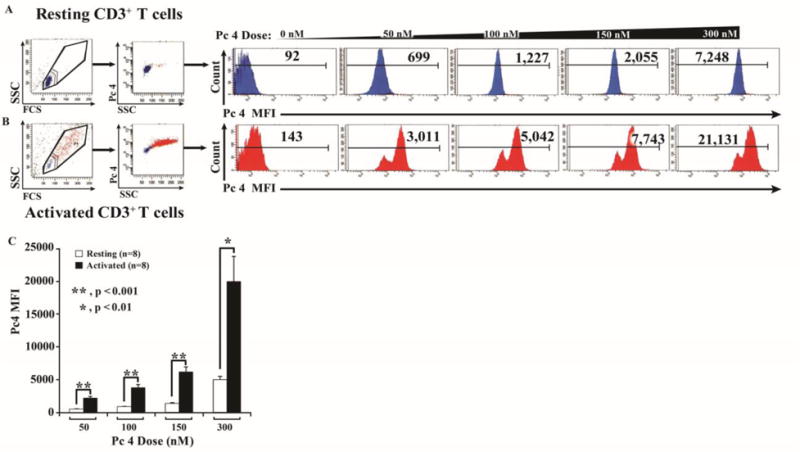
Fig 1. Activated T cells incorporate higher levels of monomeric Pc 4 than resting T cells.

Activated or resting T cells were incubated with Pc 4 (0–300 nM) in complete medium for 2 h. To measure monomeric Pc 4 levels, flow cytometric analysis was performed using a LSR II Flow Cytometer to obtain the mean fluorescence intensity (MFI) for each sample. Pc 4 was excited by a broadband UV laser (335–365 nm) and fluorescence emission was collected with a 650-nm long-pass filter. Autofluorescence was subtracted from each sample. (A & B) Representative examples of the resting (A) and activated (B) populations are shown from 8 independent experiments (individuals). (C) Quantitative data demonstrating the average Pc 4 MFI ± SEM in resting and activated T cells.
