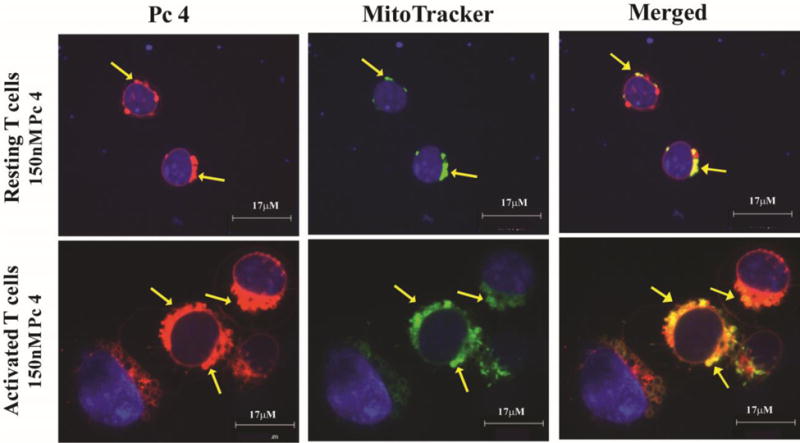
Fig. 5. Activated T cells are larger and contain proportionally increased levels of Pc 4 in mitochondria.

Activated or resting T cells were treated with Pc 4 (0–300 nM) in complete medium for 2 h. Prior to imaging, 50 nM MitoTracker Green and 10 μg/mL Hoechst 33342 were added to the cell culture for 15 min at 37°C. Stained cells were placed onto a slide with a glass coverslip and all images were acquired using the UltraVIEW VoX spinning disk confocal system mounted on a Leica DMI6000B microscope equipped with a HCX PL APO 100×/1.4 oil immersion objective. Confocal images were collected using solid-state diode lasers, with 640 nm, 488 nm and 405 nm excitation light for Pc 4, MitoTracker Green and Hoechst 33342, respectively, and with appropriate emission filters. Pc 4 (pseudo red) preferentially binds to mitochondrial membranes; mitochondria are marked using MitoTracker Green (pseudo green) and cell nuclei are marked with Hoechst 33342 (pseudo blue). The merged images in the right panel demonstrate that activated T cells, which are larger in size, as indicated by the scale bars, contain more mitochondria and proportionally increased levels of Pc 4. The yellow arrows indicate areas of co-localization between Pc 4 and MitoTracker Green.
