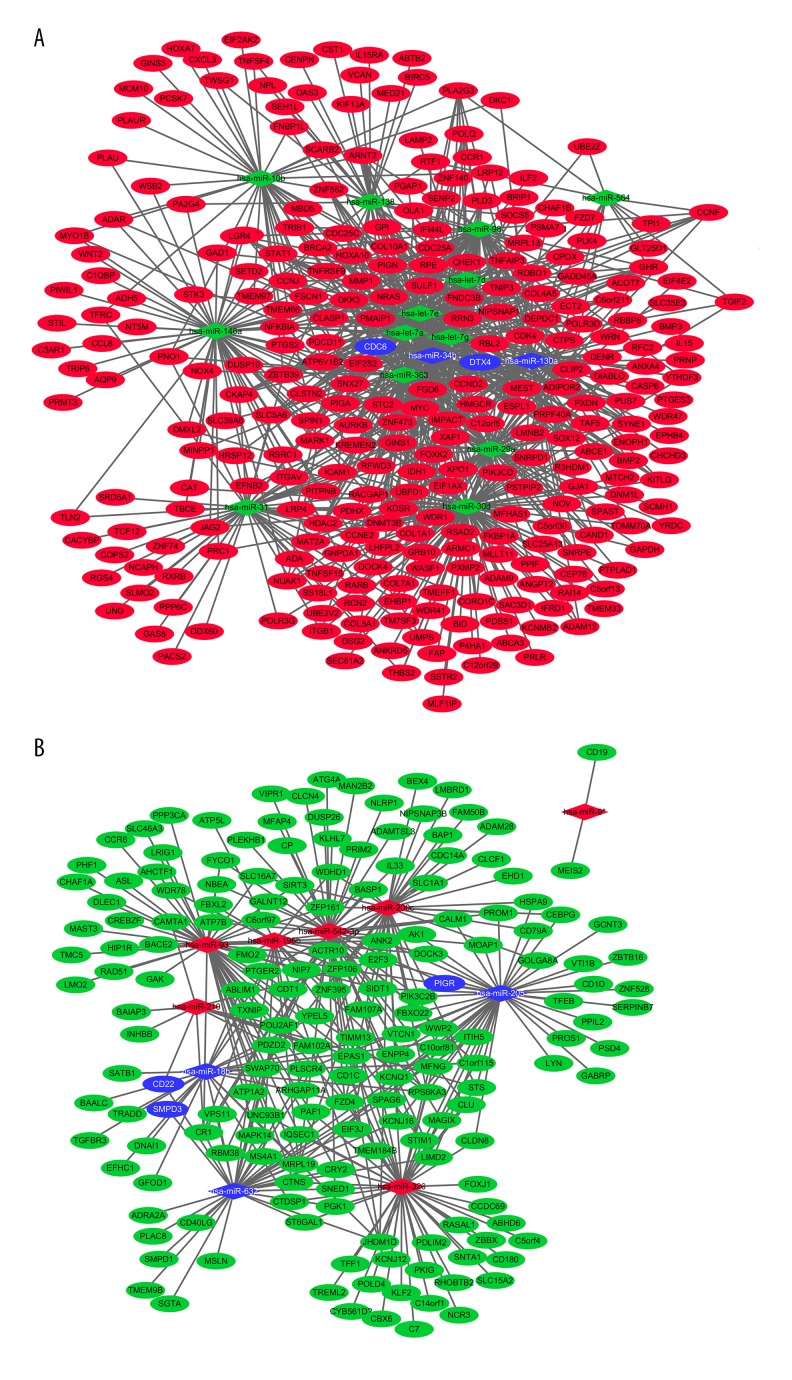
Figure 1.
miRNA-mRNA interaction network of NPC. (A) Down-regulation miRNA and up-regulation mRNA interaction network. The green and blue diamond nodes represent down-regulation, and red and blue circular nodes represent up-regulation. (B) Up-regulation miRNA and down-regulation mRNA interaction network. The green and blue circular nodes represent down-regulation, and the red and blue diamond nodes represent up-regulation. Circular nodes represent mRNAs and diamond nodes represent miRNAs. Solid lines indicate interaction associations between the miRNAs and mRNAs. The blue diamond nodes and blue circular nodes represent verified miRNA and mRNA through qRT-PCR.

