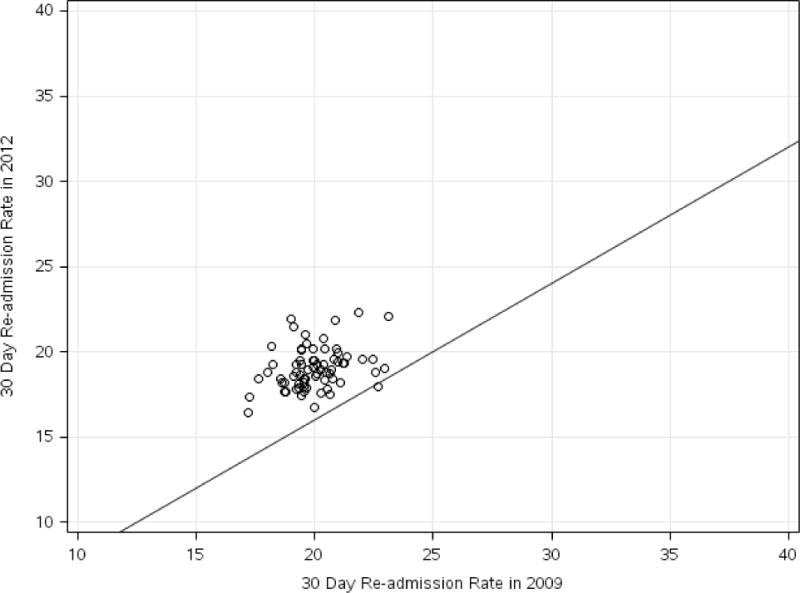
Figure 3. Comparison of 30-Day Risk-Adjusted All-Cause Readmission Rates in 2009 by 2012 per Hospital Site.

Displayed are 30-day risk-adjusted readmission rates in 2009 compared with 2012 with a 20% relative change reference line. Hospitals above the line did not achieve the stated goal of 20% relative readmission reduction, and hospitals below the line did achieve 20% relative readmission reduction.
