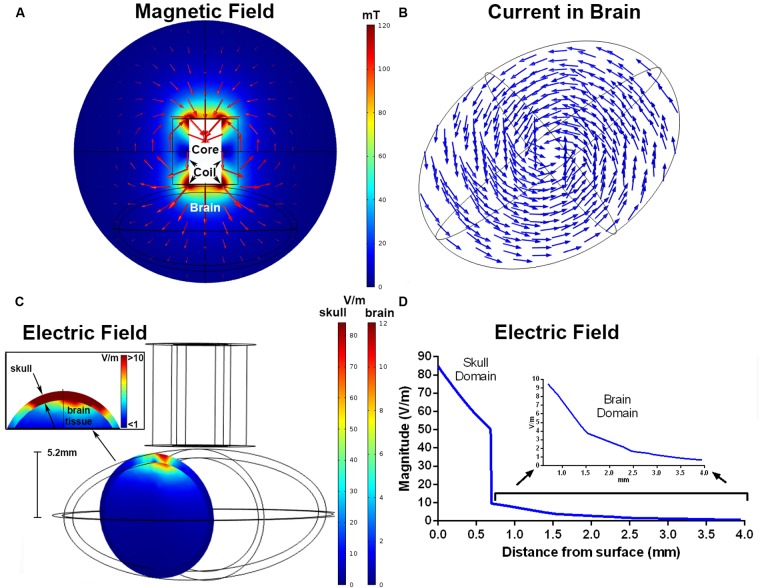
FIGURE 3.
Finite element modeling of the iron-core coil. The magnitude of the magnetic field (mT) and magnetic flux density in the xy plane (A). The arrows represent the direction of the current density separated in 15 bins. The induced current density within the brain, shown by normalized arrows separated into 12 equal bins for the xy grid and 4 in the z direction (B). Electric field magnitude (V/m) in a coronal slice of the ellipsoids representing the skull and brain below the coil windings (C). The inset shows an enlarged view of the electric field at the brain and skull interface. The simulated electric field strength within the skull and brain as a function of depth (D). The inset shows electric field strength with the brain domain on a different y-axis scale.

