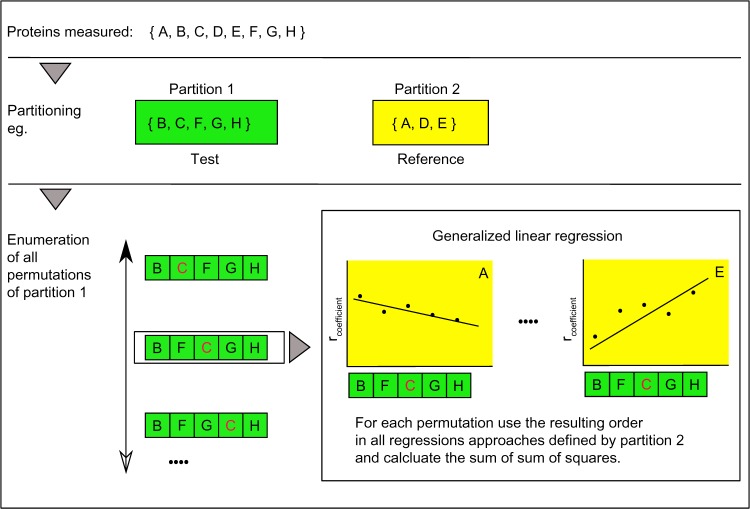
Figure 1.
Algorithm – searching for the optimal order explaining best all connected reference situations. The graph describes the core functionality of the algorithm. Top panel: as an example, a set of eight proteins named A–H was measured. Middle panel: the set of proteins is partitioned in two sets also called test and reference. The two groups can be interchanged, but normally the test group will collect less well-characterized proteins, while the reference groups might comprise well-characterized proteins, marking different equilibrium states of a biological system, eg, contrasting differentiation end points, such as CK 5/6 and CK 8/18, in basal and luminal cells in the mammalian gland. Bottom panel: The space of a complete enumeration of all test string permutations of partition 1 is searched for a minimal sum of squares resulting from the generalized regression. The regression is based on the Pearson correlation coefficients of, eg, A–B to A–H.
Note: The red character C should be a visual marker to recognize different orders in the string.

