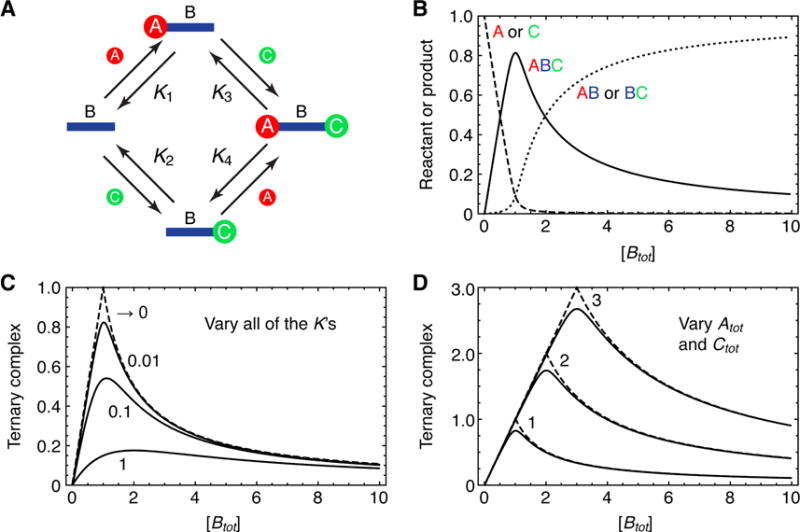
Figure 1. Equilibrium Binding of Two Ligands, A and C, to a Bivalent Adaptor B.

(A) A schematic view of the four binding reactions leading to dimeric complexes and the full ternary complex. The K’s are the equilibrium constants.
(B) Calculated equilibrium concentration of the reactants (A and C, dashed curve), the binary complexes (AB and BC, dotted curve), and the ternary complex (ABC, solid curve) as a function of the total concentration of the adaptor B. Parameter values were Atot = Ctot = 1 and K1 = K2 = K3 = K4 = 0.01.
(C) The equilibrium concentration of ABC as a function of Btot for various assumed values of all four K’s. In each case we assumed Atot = Ctot = 1.
(D) The equilibrium concentration of ABC as a function of Btot for various assumed values of Atot and Ctot. The dashed curves represent the high affinity limit (K1 = K2 = K3 = K4 → 0) and the solid curves represent K1 = K2 = K3 = K4 = 0.01.
