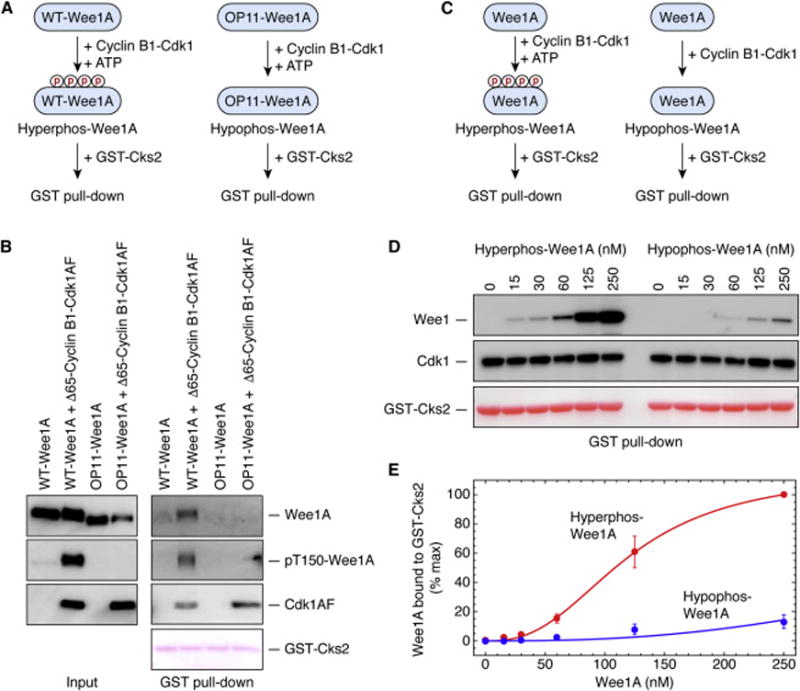
Figure 3. Dependence of Cks2-Wee1A Binding on Wee1A Phosphorylation.

(A, B) GST-Cks2 pulls down phosphorylated Wee1A but not mock-phosphorylated OP11-Wee1A. (A) Schematic view of the experiment. The concentrations of the Wee1A, Δ65-cyclin B1, and Cdk1AF were ~20 nM; the concentration of GST-Cks2 was ~300 nM. (B) Immunoblots (for total Wee1A, pT150-Wee1, and Cdk1AF) and Ponceau S staining (for GST-Cks2).
(C–E) GST-Cks2 pulls down hyperphosphorylated Wee1A better than hypophosphorylated Wee1A. (C) Schematic view of the experiment. Protein concentrations were: Δ65-cyclin B1, ~200 nM; Cdk1AF, ~200 nM; GST-Cks2, ~300 nM; and Wee1A, various concentrations, as shown. (D) Wee1A, Cdk1, and GST-Cks2 in the GST pull downs, from one experiment. (E) Quantitative Wee1A pulldown data as averages ± S.E. for 4 experiments.
