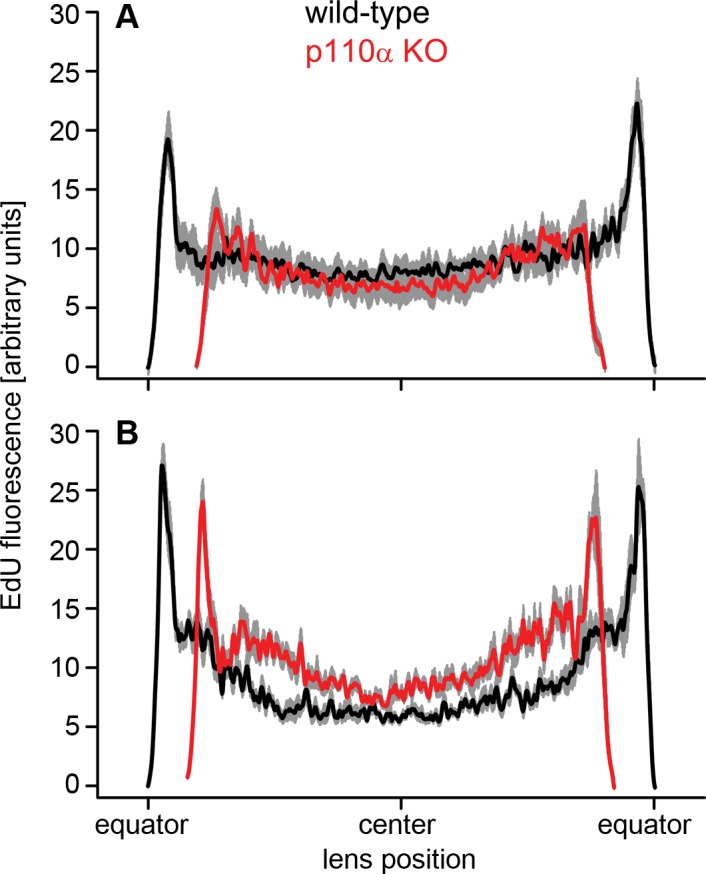
Figure 6.

Quantification of germinative zone staining on P0 and P2. (A) On P0, p110α knockout lenses (red line) had peak fluorescent intensity values near the equator that were 41% lower than those in wild-type (black line [P < 0.05]). (B) By P2, there were clear peaks of EdU labeling near the equator of p110α-deficient lenses, and the maximum fluorescence was only 12% lower than that in wild-type (P > 0.05). Data are mean ± SE (gray lines) and aligned at the center of the lens. The diameters of p110α KO lenses were 11% to 12% smaller on P0 and P2. n = 6 lenses of each genotype at each time point.
