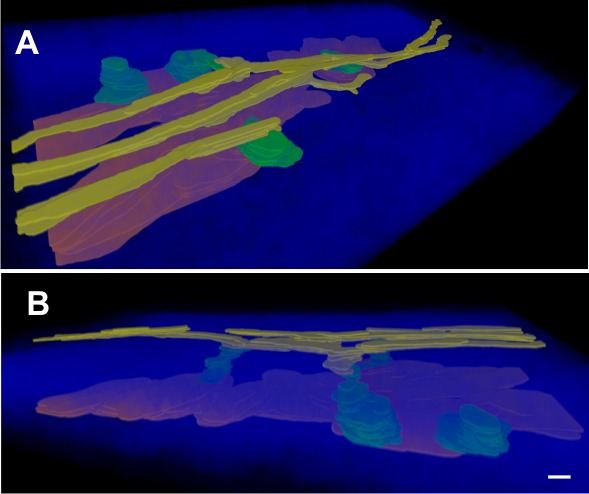
Figure 4.

Three-dimensional image reconstruction and segmentation of the AOS taken from a spectral TPM image stack. The small structures within the AOS and their spatial relations can be visualized in this 3D reconstruction. (A) View from outside the eye looking into sclera and (B) the same reconstruction viewed from the side. SC (red), CCs (green), and AV (yellow), are rendered within the SHG collagen (transparent blue) within the scleral tissue. Note that one of CCs terminated within the sclera without connection to an AV. Scale bar: 30 μm in the x- and y-axes and 15 μm in the z-axis (the z-axis is dilated by a factor of 2 for better visualization).
