Figure 5.

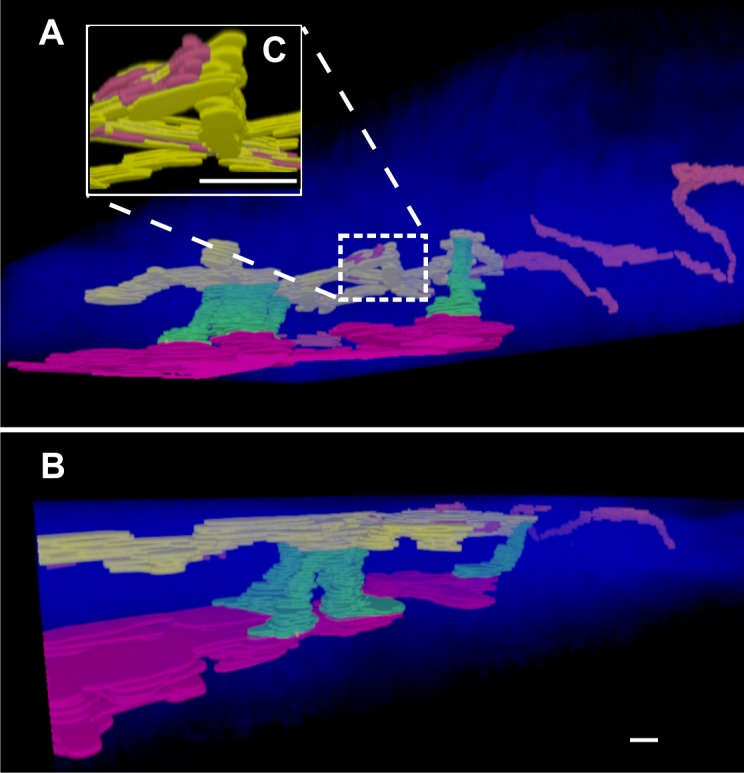
Three-dimensional reconstruction and segmentation of the AOS of a C57BL/6 mouse eye after cardiac perfusion with FITC-dextran. (A) View from inside the eye looking into sclera; (B) the same reconstruction viewed from the side. In this set of rendered images, multiple CCs (green) can be seen traveling radially from the SC (red) toward a pair of AVs (yellow). These AVs then terminate at EVs (red/orange), which then travel a convoluted path along the surface of the scleral collagen. In (C), the convoluted connection between AVs and EVs has been enlarged for better visualization. Scale bar: 30 μm in the x- and y-axes and 15 μm in the z-axis (the z-axis is dilated by a factor of 2).
