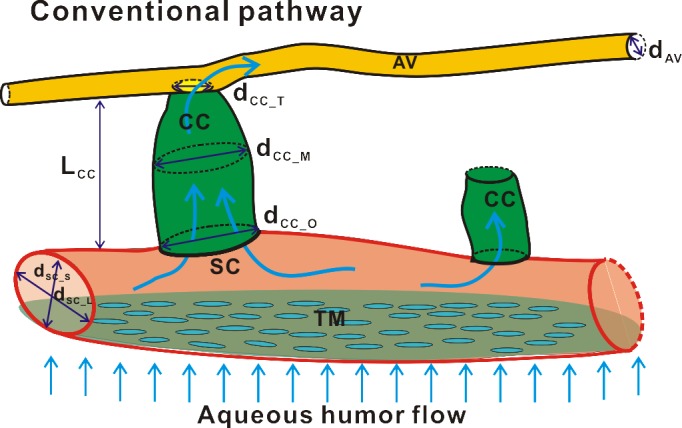
Figure 7.

A schematic diagram illustrates the small structures (SC, CC, and AV) and the interconnections between these structures within the AOS. Dimensions of these small structures were quantitatively measured and tabulated in the Table: dsc_L and dsc_S indicate the long and short axes of SC; dcc_O, dcc_M, and dcc_T represent the diameters of CC at the ostia, middle, and top locations; and the dAV, represents the diameter of AV.
