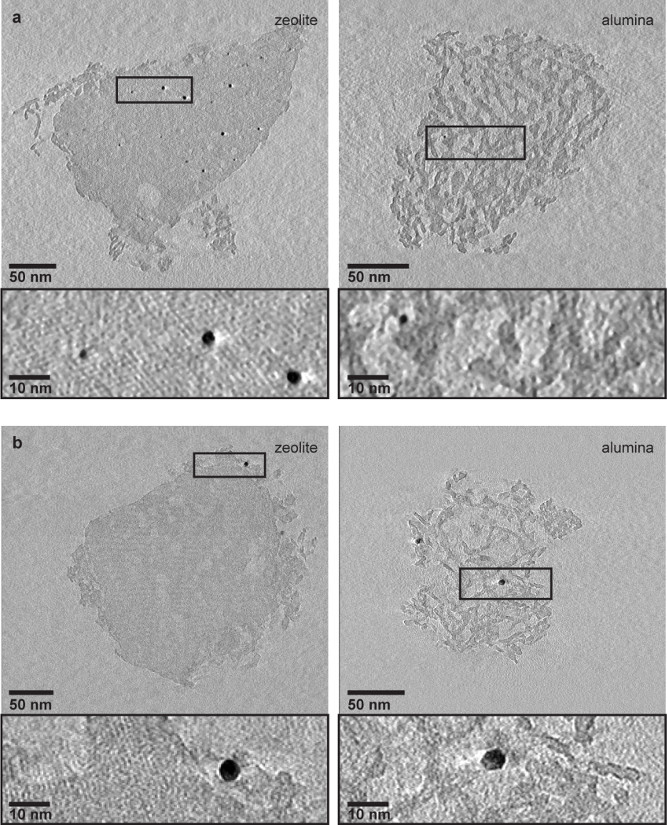
Extended Data Figure 3. 3D structural analysis using electron tomography.
a, One pixel thin slices, equal to 0.34 nm (left) and 0.26 nm (right) thickness, from the middle of the electron tomography reconstructions of zeolite crystal (left) and alumina aggregate (right) of Pt-Y/A catalyst show the presence of ~ 2.5 nm Pt particles inside the zeolite crystal. Within the alumina aggregate (right), only very few Pt particles were detected, of which one is shown in zoomed-in region. b, Ten pixels thin slices, equal to 3.6 nm (left) and 2.8 nm (right) thickness, from the middle of the electron tomography reconstructions of zeolite crystal (left) and alumina aggregate (right) of Pt-A/Y catalyst show that Pt particles of ~3.5 nm diameter were located on the alumina platelets surrounding the zeolite crystal (left) and on the alumina platelets of the aggregate (right). No Pt particles were detected inside the zeolite crystal. For electron tomography analysis both catalysts were grinded, dispersed in ethanol and sonicated to break zeolite crystals and alumina aggregates apart and analyze them separately on the TEM grid.

