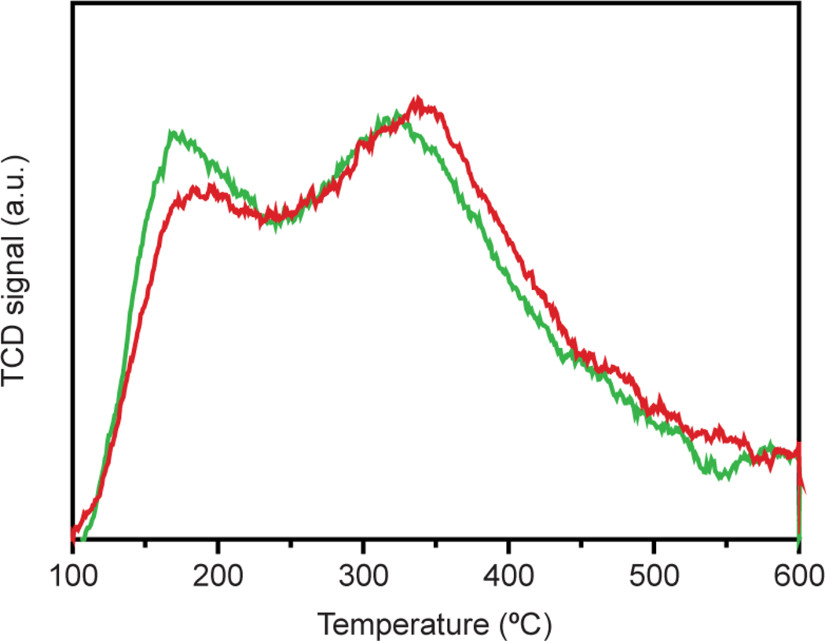
Extended Data Figure 4. Comparing acidity of the samples.
Temperature programmed desorption of ammonia of Pt-Y/A (green) and Pt-A/Y (red) catalysts displays peaks indicating weak (at ~160 °C) and strong (at ~320 °C) acid sites present within both catalysts, with Pt-A/Y catalyst showing slightly lower peak intensity in the region of weak acid site. The total amount of ammonia desorbed was measured to be 14.3 cm3 g−1 and 14.7 cm3 g−1 STP, respectively.

