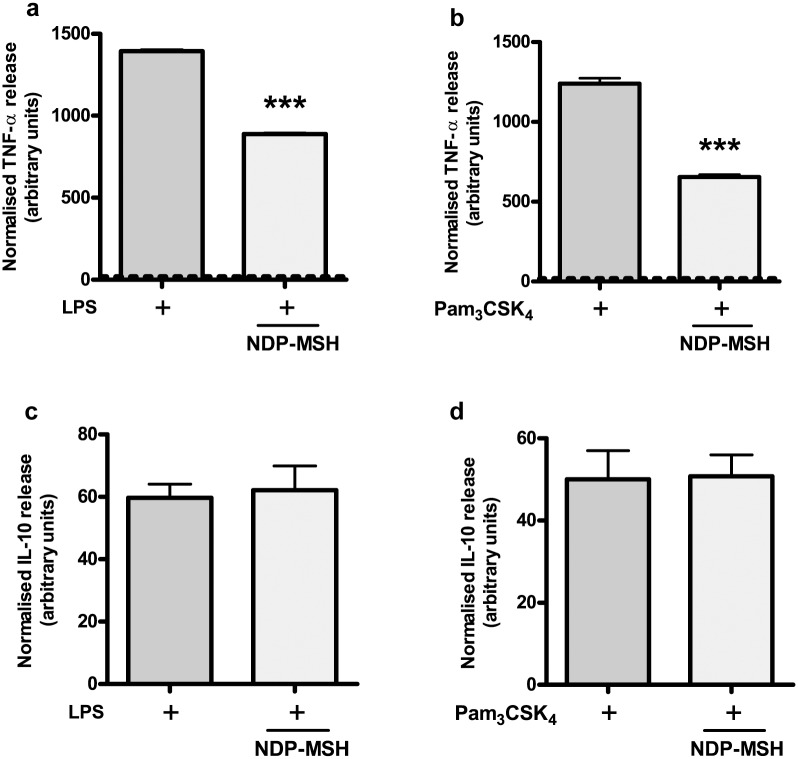
Fig 4. NDP-MSH inhibits TLR4- and TLR2-induced TNF-α release but not IL-10 release.
Cells were pre-treated for 24 hours with 100 nM NDP-MSH and then stimulated with LPS (100 ng/ml) or Pam3CSK4 (100 ng/ml). TNF-α release into the culture supernatant after 4.5 hours (a) and (b) and IL-10 release after 24 hours (c) and (d) were assessed by ELISA and normalised to the viability values obtained by the MTT assay for each experimental group (MTT values not shown). The dotted line in (a) and (b) represents values of TNF-α release for control groups. Data are the mean ± SEM of 6 replicates and were analysed by Student’s t test. Experiments were performed twice. (a) ***p<0.001 vs. LPS. (b) ***p<0.001 vs. Pam3CSK4.

