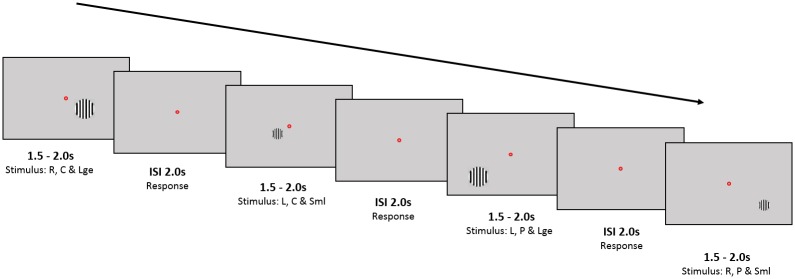
Fig 1. Schematic of MEG experiment: Example presentation of four stimuli Stimuli consisted of circular, static, high contrast, square-wave grating of 3 cycles/° spatial frequency on a mean luminance uniform grey background.
In this figure, we show an example of a large, near-central stimulus presented to the right hemisphere (Block1); a small, near-central stimulus presented to the left visual hemifield (Block3); a large, peripheral stimulus presented to the left hemifield (Block5) and a small, peripheral stimulus presented to the right hemifield (Block7). These stimuli are spaced in time by an interstimulus interval of 1.5-2seconds. Participants were instructed to fixate on the red dot and respond whenever a stimulus disappeared. Abbreviations: R = Right; L = Left; C = Near-Central; P = Peripheral; Sml = Small; Lge = Large; ISI = Interstimulus interval.

