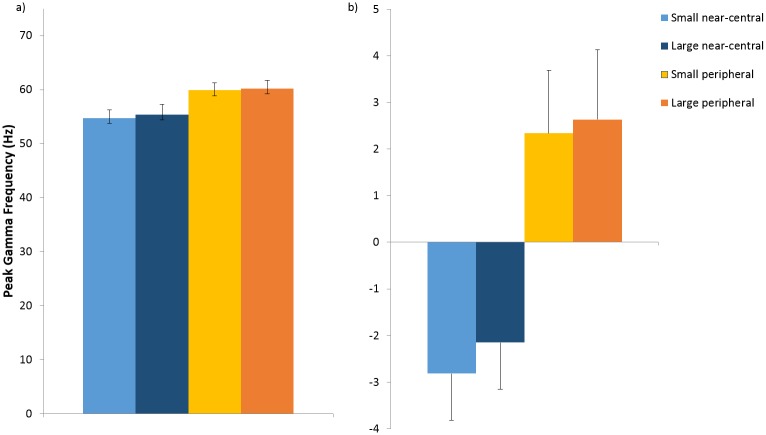
Fig 3. Peak Gamma Frequency induced by each visual stimulus.
a) Average absolute peak gamma frequency for each stimulus (left and right hemisphere combined); b) Average within-participant mean-centered peak gamma frequency for each stimulus (left and right hemisphere combined). Error bars denote 1 standard error of the mean.

