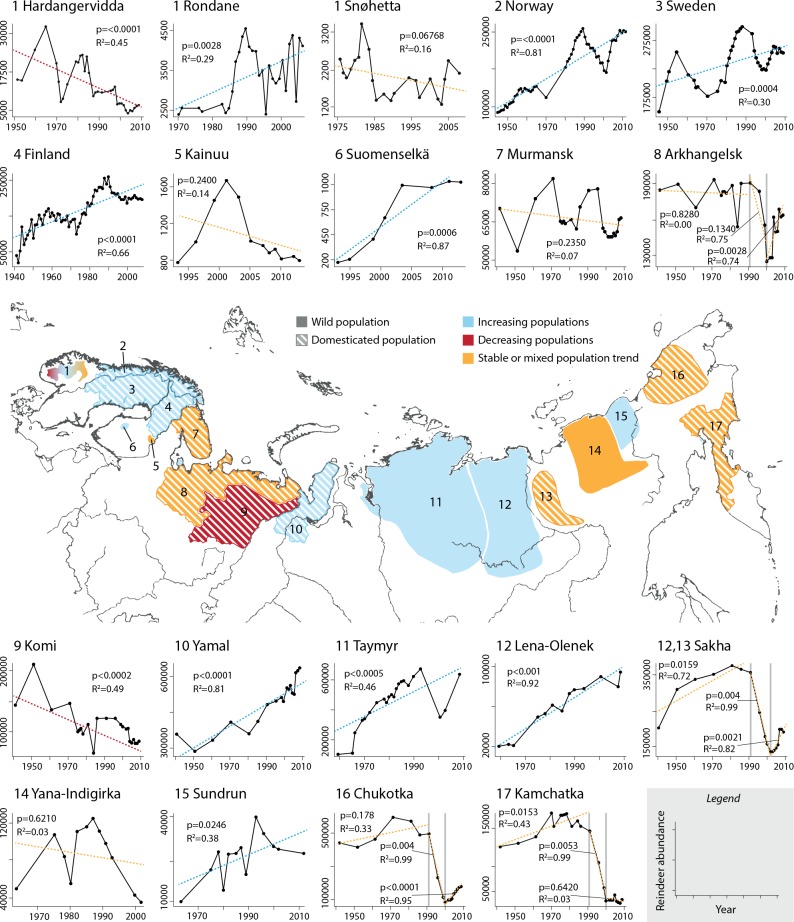
Fig 1.
Central panel—Ranges of 19 major reindeer populations in Eurasia. Upper and lower panels—Plots representing the time series of available abundances for each population. Each plot number corresponds to a range in the map and is followed by the name of the population. The color-coded lines in the plots show the trend in the time series (p-values and R2 provided for each trend are the result of regression analyses with time in years as predictor variable and reindeer abundance as response variable).

