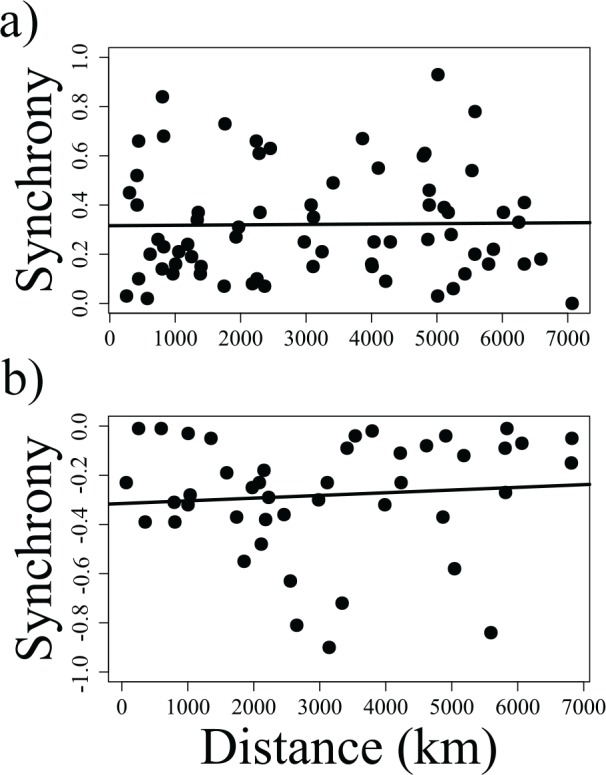
Fig 2. Relationship between synchrony in the growth rates of pairs of reindeer populations and the distance separating them.

Distance was estimated as the linear distance separating centroids of population ranges. Panel a) represents all positive synchronies we detected; panel b) represents all negative synchronies we detected (see S3 Table for details). The solid, black lines represent the results of linear regression models with synchrony as response variable and distance as predictor variable (both relationships not significant, panel a): p-value = 0.9240; panel b): p-value = 0.7447).
