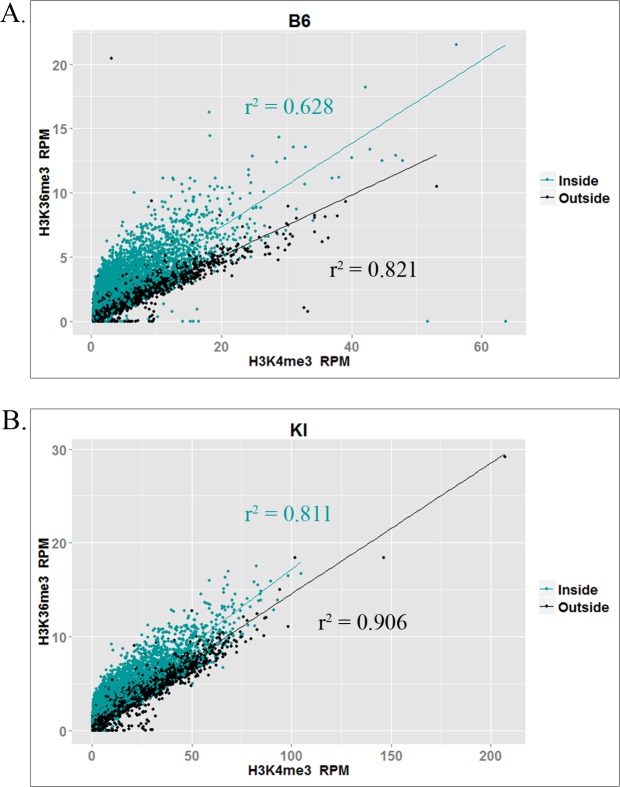
Fig 2. Correlation between H3K4me3 and H3K36me3 at hotspots.
Plots show correlations between normalized (RPM) H3K4me3 and H3K36me3 ChIP-seq reads at individual hotspots in (A) the B6 strain and (B) the KI strain. Trendlines and correlation coefficients are shown for the subset of hotspots inside (teal) and outside (black) transcribed genes.

