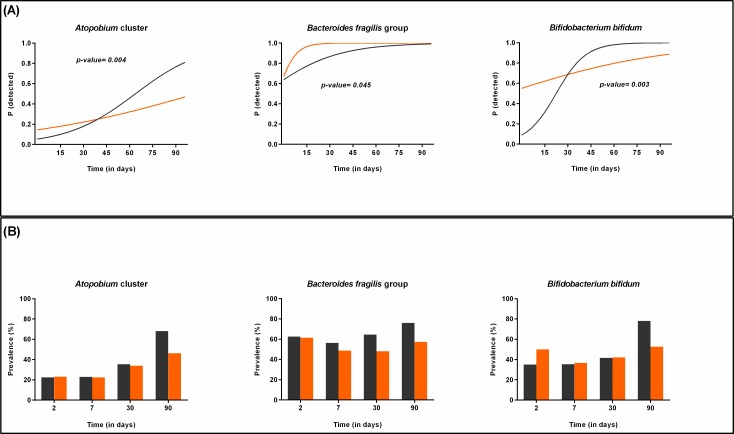
Fig 9. Bacterial groups or species influenced by the presence/absence of older siblings (I).
(A) Probability to detect Atopobium cluster, B. fragilis group and B. bifidum in firstborn infants (orange) compared to those having older siblings (grey) during the first 3 months of life as calculated by the statistical model. (B) Prevalence of Atopobium cluster, B. fragilis group and B. bifidum in firstborn infants (orange) compared to those having older siblings (grey) during the first 3 months of life as represented by the original data.

