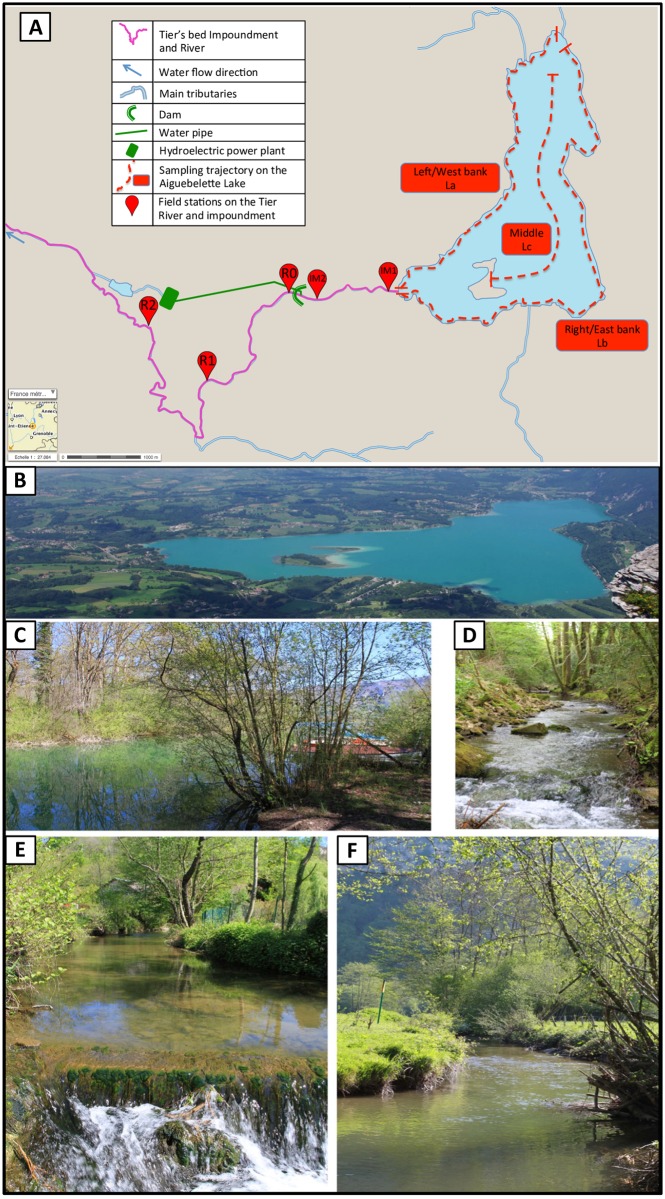
Fig 1. Studied catchment area and localization of the sampling sites.
(A) Map of the studied catchment area and localization of the sampling sites: The dotted red lines show the eDNA sampling trajectory on the Aiguebelette lake: La = Left/West bank (4.7 km) trajectory, Lb = Right/East bank (6,7 km) trajectory, Lc = Middle (3,5 km) trajectory; IM1 and IM2, sampling sites on the impoundment respectively 0.2 km and 1.3 km from the lake outlet; R0, R1 and R2, sampling sites on the Tier river respectively 1.7, 3.6 and 6.9 km downstream from the lake outlet. Pictures of Aiguebelette Lake from the south side (B), impoundment at IM1 (C) and Tier River at R0 (D), R1 (E) and R2 (F). Photo credits: M. Bouron (B) and R. Civade (C to F).

