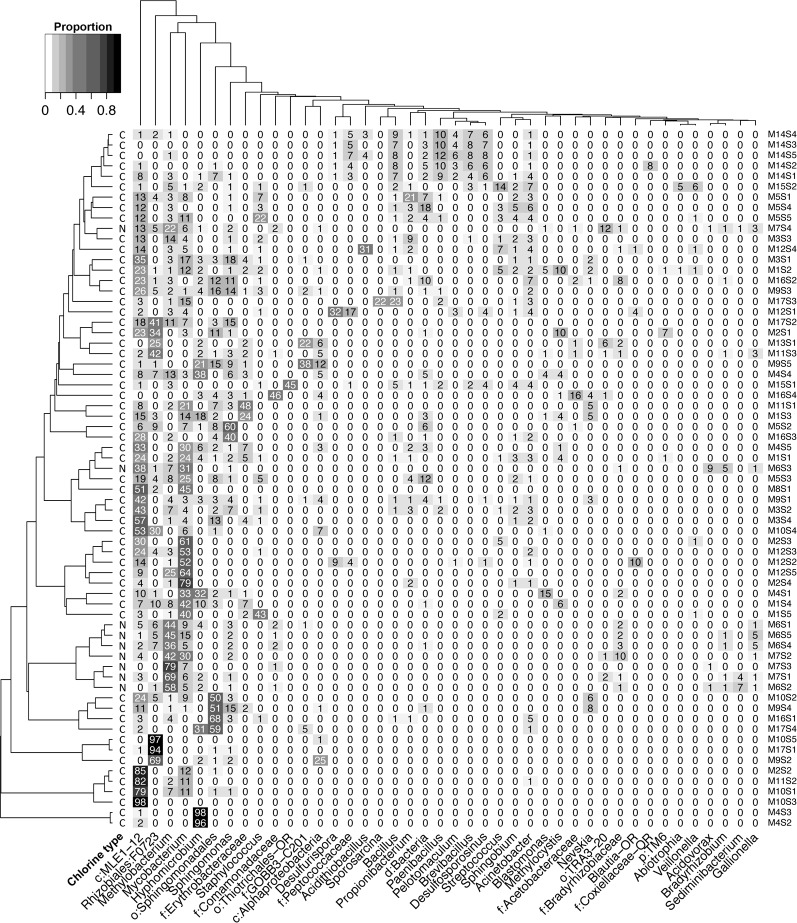
Fig 2. Heatmap showing distributions of bacterial taxa across tap water samples.
Taxa with a minimum abundance of 5.0% in at least one sample were included. Proportional abundances are indicated with values and by shading. The dendrograms were calculated based on the complete linkage hierarchical clustering algorithm and highlight the similarities in taxonomic composition among samples (left dendrogram), and the similarities in taxon distribution (upper dendrogram). The letters denote disinfection type (C = chlorine, N = chloramine). Taxonomic identities are provided to the highest resolution provided by the Silva reference database for that OTU, typically the genus level. f = family; o = order; c = class; p = phylum. The–OR designation indicates a new taxon recovered from this study.

