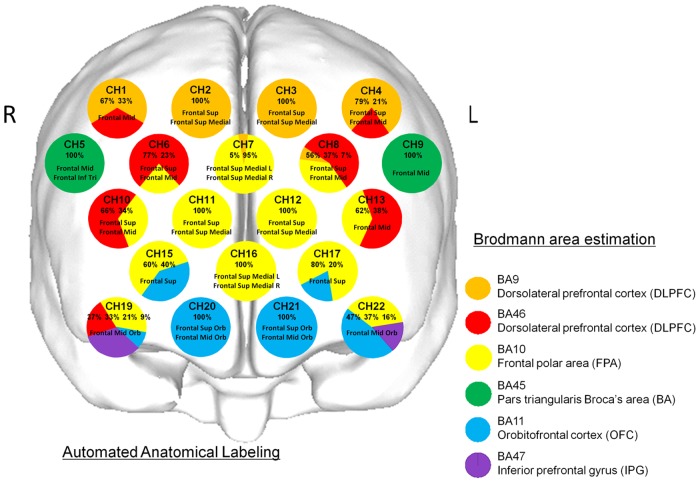
Fig 2. Anatomical identification of near-infrared spectroscopy channels.
The coordinates for all probe and anatomical landmark positions (Nz, Iz, A1, A2, Cz) were obtained using a 3-dimensional digitizer. Probabilistic registration was used to transcribe the measuring points for each subject according to the protocol of the Montreal Neurological Institute and those points were projected onto the cortical surface. Anatomical localization was identified using the Platform for Optical Topography Analysis Tools, with reference to the Automated Anatomical Labeling system. Orange, red, yellow, green, blue, and purple represent DLPFC (BA9), DLPFC (BA46), FPA (BA10), BA (BA45), OFC (BA11), and IPG (BA47), respectively. Each circle corresponds to a channel and the pie chart within each circle shows the percentages of areas in that channel.

