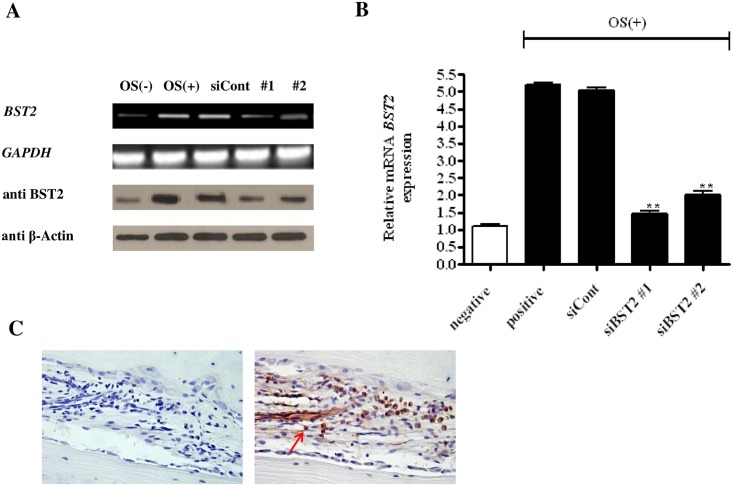
Fig 1. Effects of BST2 knockdown by siRNA on BST2 expression in hAD-BMSCs.
RT-PCR and immunoblotting analyses (A) as well as qRT-PCR (B) demonstrated that the expression of BST2 was lower in cells treated for 5 days with OS and siBST2 #1 or #2 than in cells treated with OS and non-targeting siRNA (siCont). (C) Expression of BST2 in the human bone marrow. Representative immunostaining of BST2 in the human bone marrow was observed under light microscope (magnification ×400). Brown staining (marked with a red arrow) indicates the expression of BST2 in bone marrow. Values are expressed as means ± SEM (standardized mean difference) **, P<0.01 compared withthe expression level in cells treated with the control siRNA (siCont) (n = 4).

