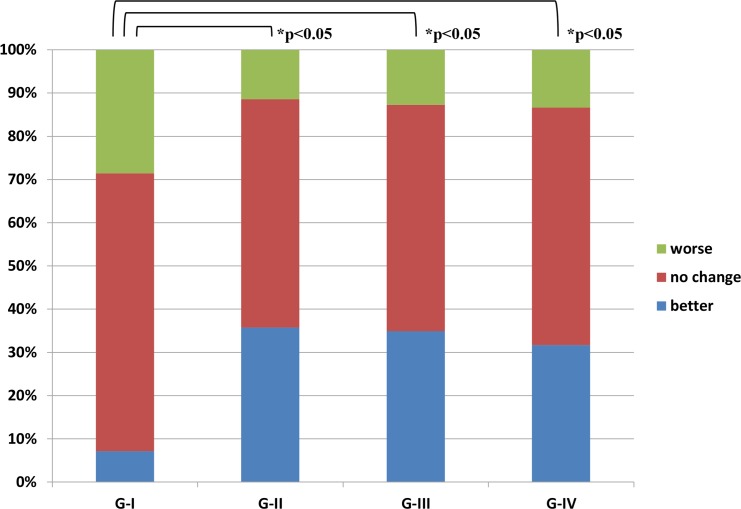
Fig 3. Two-year follow-up hearing in patients with definite Meniere's disease.
Ratios of the number of cases with “better hearing”, “no change of hearing” and “worse hearing”18–24 months after treatment are shown in each group. “Better”, ≥10 dB difference between pre- and post-treatment hearing levels; “worse”, ≤−10 dB difference; “no change”, other. *: statistically significant. Percentages mean ratios of the number of these patients.

