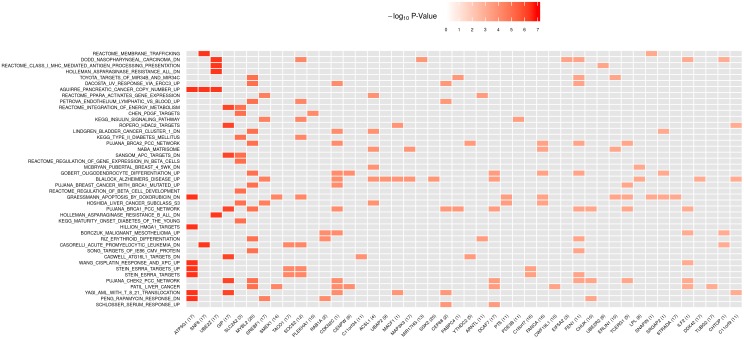
Fig 3. Heat map of gene-level p-values on selected genes within 43 significant pathways based on the DIAGRAM and GERA studies.
There are 46 unique genes in the 43 significant pathways that have their gene-level meta-analysis p-values less than 0.001. Each row in the plot represents one of 43 significant pathways. Each column represents one of the 46 unique genes. The chromosome IDs of 46 unique genes are given in parentheses. The color of each cell represents the gene-level p-value (in the −log10 scale). A cell for a gene that is not included in a pathway is colored gray in the corresponding entry. The orders of genes (x-axis) and pathways (y-axis) are arranged according to their gene and pathway meta-analysis p-values.

