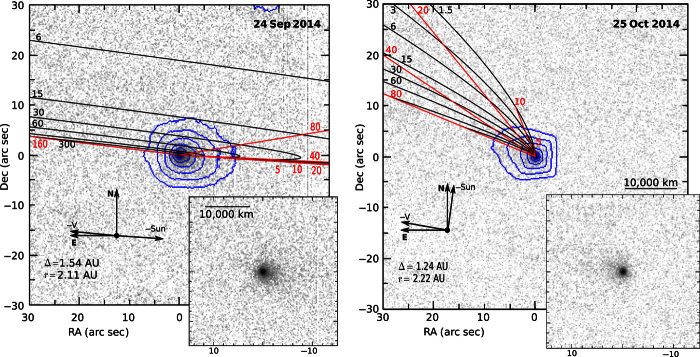
Fig. 2. Images of C/2014 S3 (PANSTARRS) obtained on 24 September 2014 (left) and 25 October 2014 (right) with the CFHT.
The background stars have been processed out of these composites. The comet was at heliocentric distances (r) of 2.11 and 2.22 AU, moving outward from its perihelion at 2.05 AU on 13 August 2014. The syndynes (black; grain sizes are expressed in micrometers) and synchrones (red; positions noted in days before the observations) map out the expected position of the dust released from the nucleus under the influence of solar radiation pressure. Different lines indicate the locus of dust of different sizes released at different times; the marked change between the two epochs reflects very different viewing geometries. The blue isophotes are equally spaced on a logarithmic scale. The insets are at the same scale as the main images. The arrows indicate the directions of North and East and of the antisolar and negative of the heliocentric velocity vectors (−V). Dec, declination; RA, right ascension; Δ, geocentric distance.

