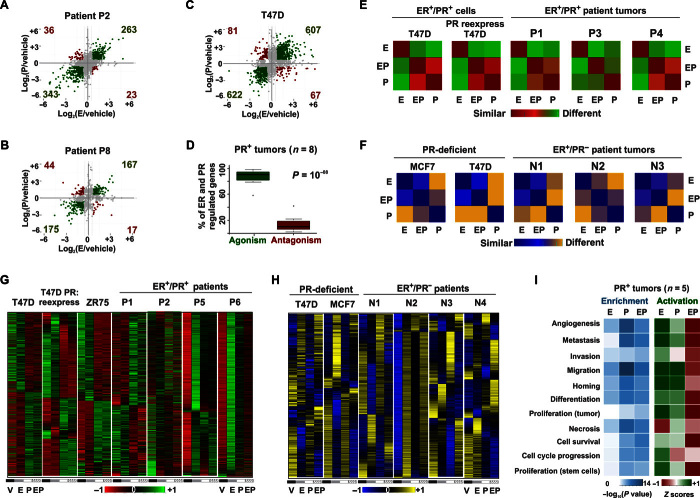
Fig. 1. Genomic agonism and phenotypic antagonism between ER and PR in breast cancer.
(A to C) Estrogen and progestin independently regulate gene expression in the same direction for representative patients (A) P2, (B) P8, and (C) T47D cells. Axes denote log fold change of gene expression in response to estrogen (E) or progestin R5020 (P) treatment relative to vehicle (V). Green dots represent genes regulated in similar directions by estrogen or progestin. Red dots represent genes regulated in different directions by estrogen or progestin. (D) Box plot depicts the percentage of all ER- and PR-regulated genes in ex vivo cultured primary breast tumors (n = 8) for which progestin is an agonist or antagonist of estrogen-regulated gene expression. (E and F) Similarity matrices represent correlation between estrogen-, progestin-, and EP-regulated levels of transcriptomes in (E) a PR+ milieu and (F) a PR− milieu. (G and H) Expression of estrogen and progestin-regulated genes in (G) a PR+ milieu (four ER+/PR+ ex vivo cultured human tumors and T47D, ZR75, and T47D PR-deficient cells with ectopic reexpression of PR) and (H) a PR-deficient milieu (four ER+/PR− tumors and PR-deficient T47D and MCF7 cells). Tumors were treated ex vivo and cell lines in vitro with vehicle, estrogen, or progestin or concomitantly with both hormones (EP). All heat maps are row-normalized and include the union of ER- and PR-regulated genes. For any given gene, red (or blue) and green (or yellow) colors of a row-normalized heat map represent minimum and maximum magnitudes of normalized expression that are observed in response to various treatments. (I) Enrichment (P values) and Z scores of activation of functional processes by estrogen-, progestin-, and EP-regulated transcriptomes in five human tumor explants treated ex vivo for 24 hours. For cell models, RT-PCR assessments of RNA-seq were done as three independent experiments (three technical replicates per experiment) (fig. S3). RNA-seq was performed on one of the three biological replicates. For a subset of human tumors, the RT-PCR assessment of estrogen-mediated regulation was done for TFF1, GREB1, and PR genes (table S1). The lists of genes and their expression in response to various treatments are provided in tables S4 and S5.

