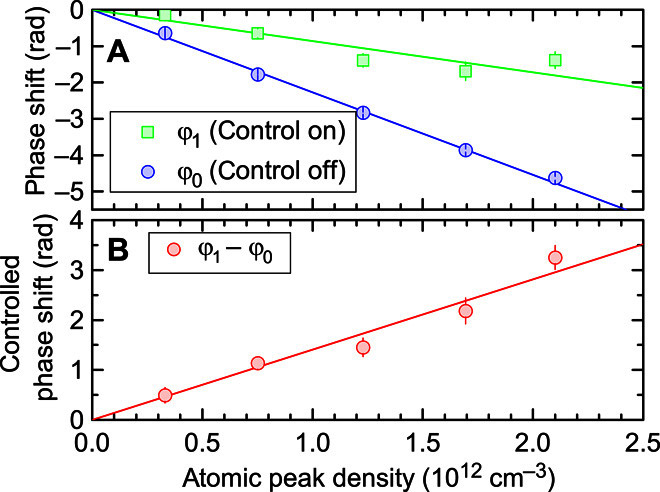
Fig. 3. Controlled phase shift.

(A) The phase shift φ0 in the absence of a control pulse (blue circles) depends linearly on atomic density, so does the phase shift φ1 in the presence of a control pulse (green squares) but with a different slope because of Rydberg blockade. (B) The difference between the two phase shifts yields the controlled phase shift φ1 − φ0, which is equal to 3.3 ± 0.2 rad for the rightmost data point. The lines show linear fits.
