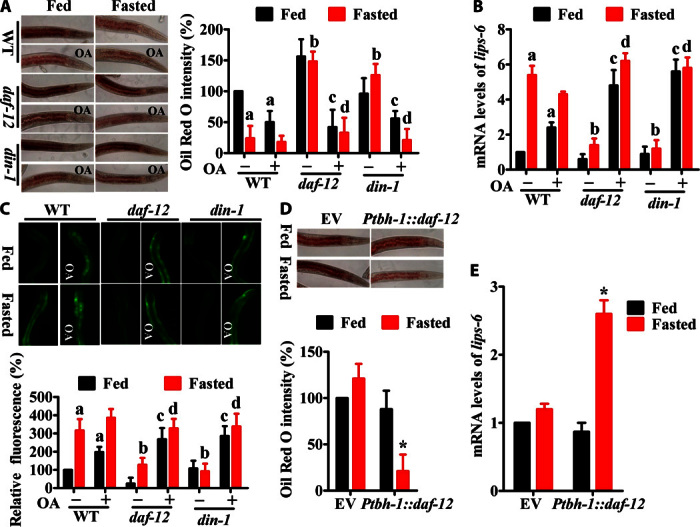
Fig. 5. DAF-12/DIN-1 confers resistance to starvation.

(A) Mutation in daf-12(rh61rh411) or din-1(dh127) suppressed lipid hydrolysis determined by Oil Red O staining after 24 hours of starvation. Application of octopamine (1 mM) restored fasting-induced breakdown. The right panel represents relative Oil Red O intensity. Results are means ± SD of three experiments. (B and C) Expression of lips-6 in WT, daf-12(rh61rh411), and din-1(dh127) worms after 12 hours of starvation. (B) lips-6 mRNA levels. (C) Expression of Plips-6::gfp. The right part shows quantification of GFP levels. Results are means ± SD of three experiments. aP < 0.05 versus well-fed WT worms; bP < 0.05 versus starved WT worms; cP < 0.05 versus well-fed daf-12(rh61rh411) or din-1(dh127) worms; dP < 0.05 versus starved daf-12(rh61rh411) or din-1(dh127) worms. (D and E) Expression of daf-12 under the control of the tbh-1 promoter restored lipid hydrolysis (D) and the expression of lips-6 (E) in daf-12(rh61rh411) animals. The lower panel represents relative Oil Red O intensity (D). Results are means ± SD of three experiments. *P < 0.05 versus empty vector.
