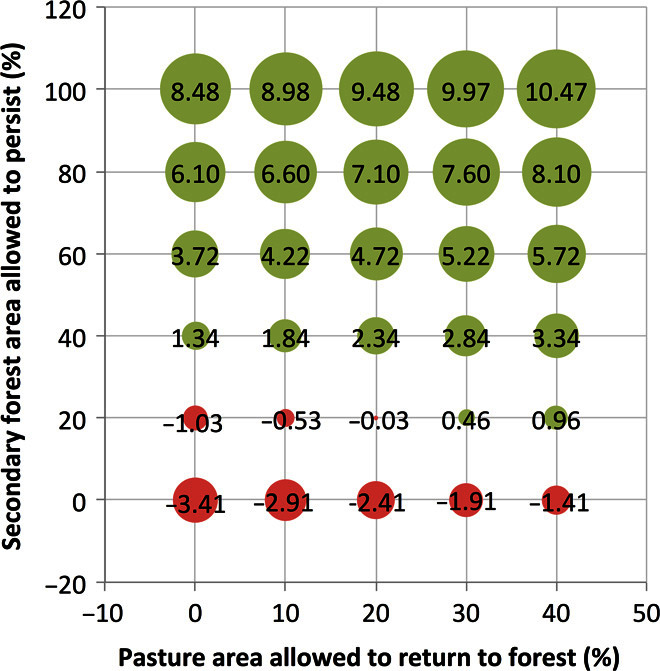
Fig. 3. Potential AGC sequestration (in petagrams) for scenarios of combinations of land use over four decades (2008–2048).

Land-use change combinations incorporate the percentage area of land allowed to regenerate following pasture abandonment (0 to 40% cessation of pasture use) and the percentage of YSF (≤20 years) and MSF (20 to 60 years) areas allowed to persist and continue regeneration (0 to 100% forest persistence). The size of the circles indicates the potential amount of carbon sequestered. Values in the cells indicate the magnitude of net carbon sequestered over 40 years (in petagrams), with all possible combinations of the two factors. These scenarios account for carbon loss due to SF clearing, which can lead to negative net carbon sequestration (red circles).
