
Fig. 6. Monte Carlo simulations agree well with experimental results.
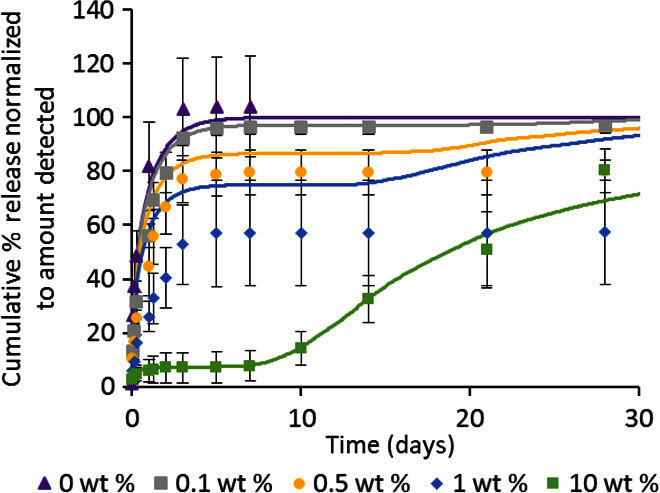
Release of NT-3 from HAMC with 10 wt % PLGA np (Fig. 4B, i) was fitted using three-dimensional on-lattice Monte Carlo simulations. Simulations were then run for all other nanoparticle concentrations in Fig. 4B(i) using the same parameters. The combined reduced χ2 value for all simulations was 3.9. Symbols represent data, whereas solid lines represent the simulation results.