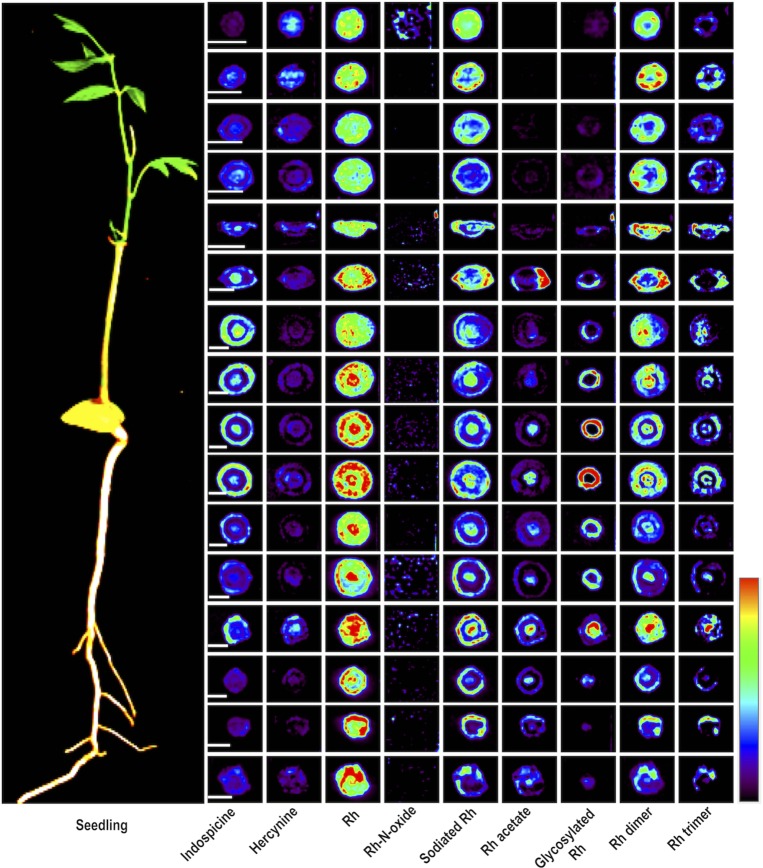
Fig 4. DESI MS images showing the distribution of Rh and other related compounds in different cross sections of root and shoot of a 10 months old seedling of D. binectariferum.
Scale bars correspond to 2 mm and apply to all the images of a row. Intensity normalization of the images was done separately for all the individual metabolites.

