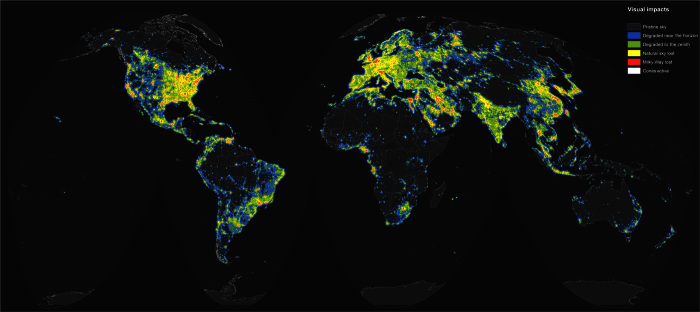
Fig. 10. Map of light pollution’s visual impact on the night sky.
The sky brightness levels are those used in the tables and indicate the following: up to 1% above the natural light (0 to 1.7 μcd/m2; black); from 1 to 8% above the natural light (1.7 to 14 μcd/m2; blue); from 8 to 50% above natural nighttime brightness (14 to 87 μcd/m2; green); from 50% above natural to the level of light under which the Milky Way is no longer visible (87 to 688 μcd/m2; yellow); from Milky Way loss to estimated cone stimulation (688 to 3000 μcd/m2; red); and very high nighttime light intensities, with no dark adaption for human eyes (>3000 μcd/m2; white).

