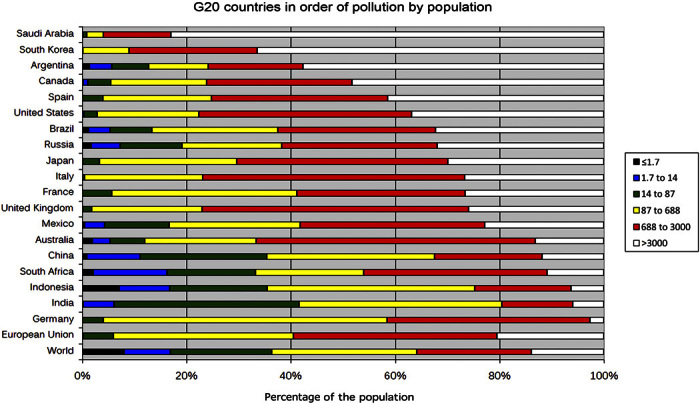
Fig. 11. G20 countries sorted by population exposed to light pollution.

Countries of the G20 group whose populations live under skies polluted by the specified artificial sky brightness. Color ranges are shown on the right and indicate the pollution level (μcd/m2).
