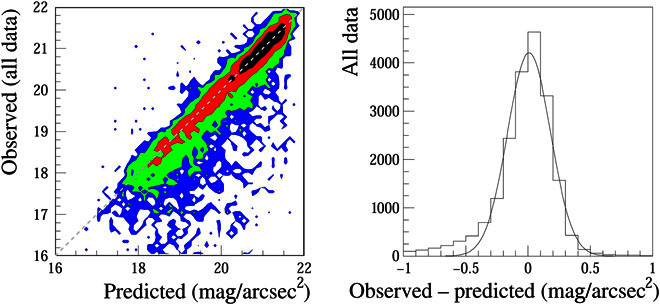
Fig. 16. Comparisons between sky brightness observations and atlas predictions.

(Left) Contour plot comparing the weighted number of SQM observations to the predictions of the atlas in 0.1 magSQM/arcsec2 bins. The colors are scaled logarithmically relative to the peak: <0.7 weighted observations (blue), 0.7 to 5 weighted observations (green), 5 to 35.5 weighted observations (red), and 35.5 to 251 weighted observations (black). (Right) Fit residuals (observed minus predicted SQM values) for the complete data set, with a Gaussian fit. Negative values mean that the observer reported a sky brighter than the atlas predicted, whereas positive values mean that the observer reported a sky darker than predicted. The tail of brighter-than-predicted observations is usually either contaminated by nearby light sources or taken in different conditions than assumed (for example, unreported clouds, haze, or fog). The histogram shows the total number of observations, not weighted observations, so some locations contribute to multiple entries.
