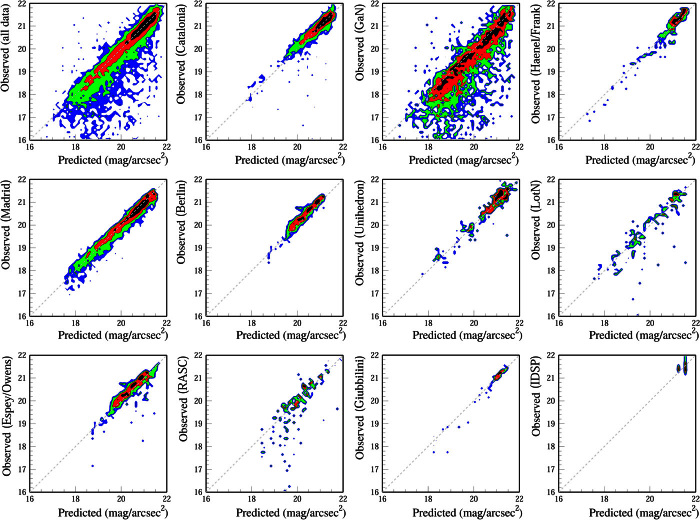
Fig. 17. Contour plots comparing the weighted number of SQM observations to the predictions of the atlas.
The color scale is logarithmic and scaled relative to the peak value. Observations by citizen scientists tend to be slightly brighter than those made by professionals, with larger tails at very bright values, likely from observations taken too near lamps or under nonideal atmospheric conditions. GaN, Globe at Night; LotN, Loss of the Night app; RASC, Royal Astronomical Society of Canada; IDSP, International Dark Sky Places.

