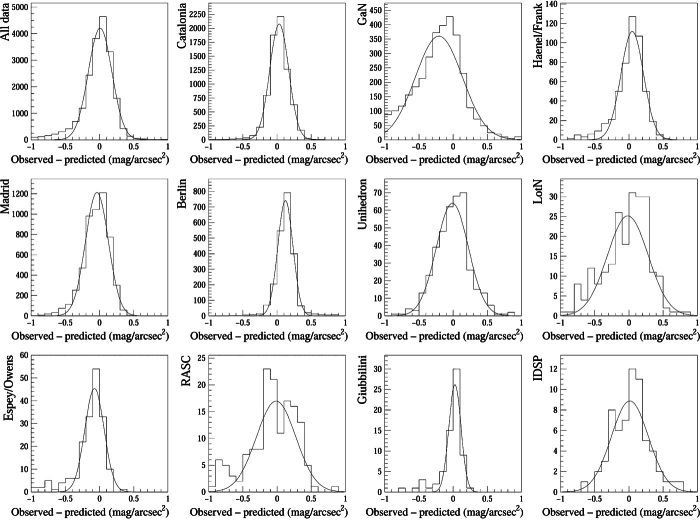
Fig. 18. Histograms showing the residuals (observed minus predicted SQM values) for the whole data set and for each of the different data providers.
Negative values mean that the observer reported a sky brighter than the atlas predicted, whereas positive values mean that the observer reported a sky darker than predicted. The histograms show the total number of observations, not weighted observations, so some locations contribute to multiple entries. Superimposed are the best-fitting Gaussians.

