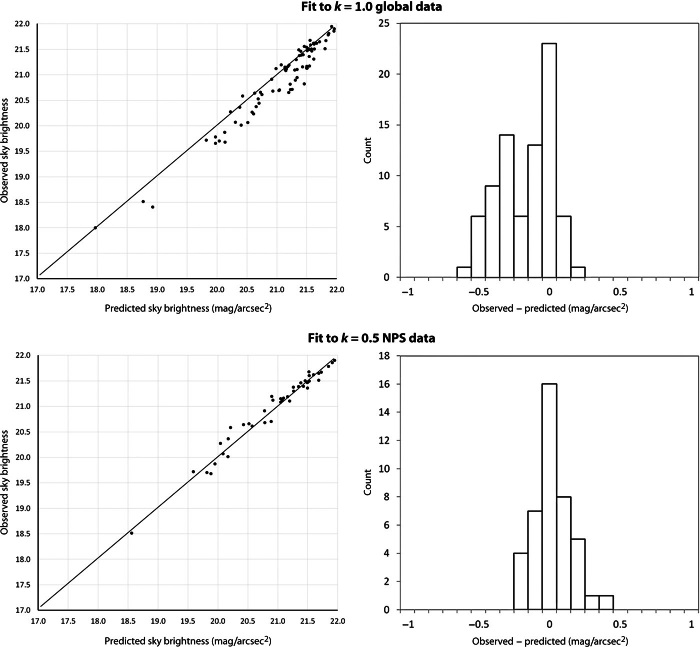
Fig. 19. Comparisons between sky brightness NPS CCD observations and atlas predictions.
(Left) Plots comparing CCD observations to the predictions of the atlas (upper graph, aerosol clarity K = 1; lower graph, K = 0.5). (Right) Fit residuals (observed minus predicted values) for the SQM-based calibration versus CCD NPS observations (upper histogram, K = 1; lower histogram, K = 0.5).

