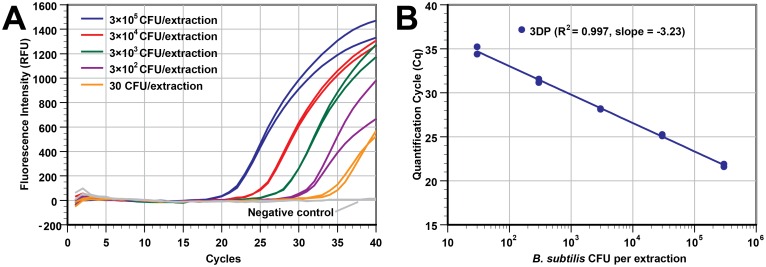
Fig 2. The 3D printer can process samples with a wide range of bacterial concentrations.
Different concentrations of B. subtilis in LB broth medium were extracted using our 3D printer protocol (duplicate wells of 3×10⁵ CFU, 3×10⁴ CFU, 3×10³ CFU, 3×10² CFU, 30 CFU, and LB broth as a negative control). DNA was eluted in 50 μL of elution buffer. (A) Real-time PCR curves from the samples with a 5-log difference in concentration. (B) The Cq values of real-time PCR in panel A was plotted against the input concentrations (R2 = 0.997, slope = -3.23). The Cq values shown here are slightly better (lower Cq) than those in S4 Fig at the same concentration because we used a smaller elution buffer volume (50 μL instead of 100 μL).

