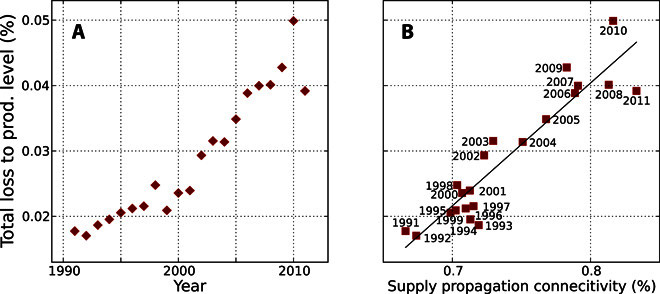
Fig. 3. Changes in network structure increase relative production loss.

(A) Relative production losses in each simulation year. The ratio of total production loss to annual production level (in %) increases with time. (B) Relative production losses increase with the static network measure SPC. The static network measure SPC correlates with the losses in each year.
