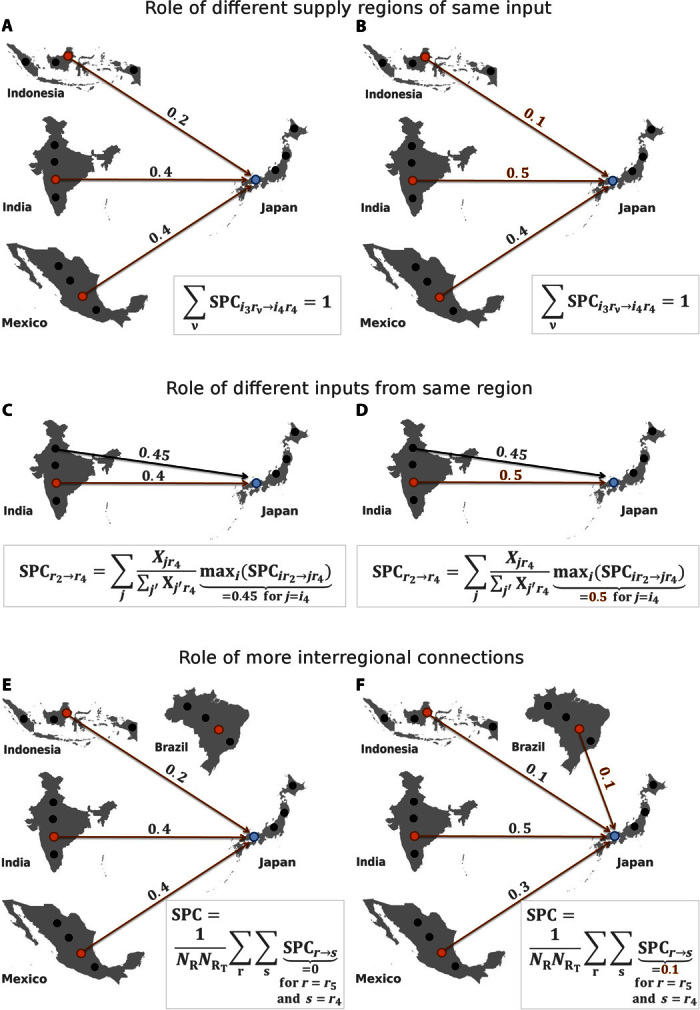
Fig. 4. Exemplary illustration of network measure SPC.

(A and B) Role of different supply regions of the same input. In this simplified example, the fourth Japanese sector obtains the input good i3 from three different tropical countries. The respective SPC values result from the share that each of these production sites has on the total supply of i3 to the Japanese sector. These shares can change over time but always add up to 1. (C and D) Role of different inputs from the same region. The dependence of Japan on supplies from India is determined by the maximal sectoral impact that India has on each sector in Japan. (E and F) Role of enhanced interregional connectedness. The global average of all regional SPC values can change either because of new connections in the network or because the established link structure varies.
